Key performance indicators for small businesses are the measurable metrics that show whether a business is growing, profitable, and positioned for long-term success.
While many business owners focus on revenue, lasting success depends on tracking key business performance indicators across all areas of the business.
This is important because around 20% of businesses fail within their first year, and nearly half do not survive beyond five years.
In this guide, we explore 15 essential KPIs every small business should track to drive growth, profitability, and long-term success.
Key Takeaways
- The most effective key performance indicators for small businesses provide clear insights into profitability, growth, customer loyalty, and operational efficiency.
- Tracking the right mix of financial KPIs, sales KPIs, marketing KPIs, customer service KPIs, and operational KPIs helps businesses make smarter decisions.
- Successful companies use business performance indicators and business metrics to track trends, identify risks early, and uncover growth opportunities.
- Understanding what KPIs are in business and reviewing them consistently transforms data into actionable strategies for long-term business success.

What Are Key Performance Indicators (KPIs)?
Key Performance Indicators (KPIs) are measurable metrics that help businesses track progress towards specific goals.
They provide valuable insights into areas such as revenue, sales, customer satisfaction, and operational efficiency, enabling business owners to make data-driven decisions and improve performance.
In simple terms, KPIs answer one critical question: Is the business moving in the right direction?
For small businesses, the right KPIs act as a roadmap for growth, helping identify opportunities, address challenges, and measure success over time.
KPIs vs Metrics
Although people often use the terms interchangeably, KPIs and metrics are not the same. Every KPI is a metric, but not every metric is a KPI.
A KPI measures progress towards a specific business objective, while a metric simply tracks an activity or process.
| KPI | Metric |
|---|---|
| Directly linked to a strategic business goal | Measures general business activity |
| Indicates success or failure against objectives | Provides supporting performance data |
| Helps guide decision-making and business growth | Helps monitor day-to-day operations |
| Usually tracked by leadership and managers | Often tracked by teams or departments |
| Example: Customer Retention Rate | Example: Number of Customer Support Tickets |
For small businesses, the goal is not to track more metrics but to focus on the KPIs that have the greatest impact on growth, profitability, and long-term success.
Why Do Small Businesses Need KPIs?
KPIs help small businesses measure progress, make informed decisions, and stay focused on their most important goals.
Without clear performance indicators, it becomes difficult to know what is working, what needs improvement, and where resources should be invested.
Some of the key benefits of tracking KPIs include:
- Measuring business growth and profitability accurately.
- Identifying problems before they affect performance.
- Improving sales, marketing, and operational efficiency.
- Enhancing customer satisfaction and retention.
- Supporting data-driven decision-making and strategic planning.
By monitoring the right KPIs, small business owners can move beyond guesswork and build a stronger foundation for sustainable growth.
The Cost of Tracking the Wrong Numbers
Many small business owners track dozens of metrics but still struggle to improve performance.
The problem is not a lack of data; it is focusing on numbers that look impressive but do not drive meaningful business outcomes.
Tracking the wrong metrics can lead to poor decisions, wasted resources, and missed growth opportunities.
Vanity Metrics vs Actionable Metrics
Vanity metrics may make a business appear successful, but they often provide little insight into actual performance.
Actionable metrics, on the other hand, help business owners make informed decisions and improve results.
| Vanity Metrics | Actionable Metrics |
|---|---|
| Social media followers | Lead conversion rate |
| Website visits | Customer acquisition cost (CAC) |
| Email subscribers | Customer retention rate |
| App downloads | Customer lifetime value (CLV) |
| Page views | Revenue growth rate |
The key question to ask is: Does this metric help me make a better business decision? If the answer is no, it is probably a vanity metric.
Common KPI Mistakes Small Businesses Make
Even businesses that track KPIs can make costly measurement mistakes. Some of the most common include:
- Tracking too many KPIs at once.
- Focusing only on revenue while ignoring profitability.
- Measuring activity instead of results.
- Failing to review KPIs regularly.
- Using the same KPIs regardless of business goals.
These mistakes often create information overload and make it harder to identify what truly drives growth.
How Poor Measurement Leads to Business Failure
When businesses track the wrong numbers, they risk solving the wrong problems. For example, a company may celebrate increasing sales while overlooking rising customer acquisition costs or declining profit margins.
Over time, these hidden issues can weaken cash flow, reduce profitability, and limit growth.
The most successful businesses focus on a small number of high-impact KPIs that align with their goals.
By measuring what matters, they can identify challenges early, make smarter decisions, and build a more sustainable business.

How to Choose the Right KPIs for Your Business
Not every KPI is relevant to every business. The most effective KPIs are those that align with your goals, measure meaningful progress, and provide actionable insights.
Instead of tracking dozens of metrics, focus on a handful of indicators that directly influence business growth and performance.
Align KPIs With Your Business Goals
Your KPIs should reflect what your business is trying to achieve.
A company focused on growth will track different KPIs than one focused on profitability or customer retention.
| Business Goal | Relevant KPIs |
|---|---|
| Increase revenue | Revenue Growth Rate, Sales Growth Rate |
| Improve profitability | Gross Profit Margin, Net Profit Margin |
| Retain customers | Customer Retention Rate, Customer Lifetime Value |
| Generate more leads | Lead Conversion Rate, Customer Acquisition Cost |
| Improve efficiency | Employee Productivity, Process Completion Rate |
The best KPI is one that clearly shows whether you are moving closer to your objective.
Use the SMART Framework
Effective KPIs should follow the SMART principle:
| SMART Criteria | Meaning |
|---|---|
| Specific | Focused on a clear objective |
| Measurable | Quantifiable and easy to track |
| Achievable | Realistic and attainable |
| Relevant | Aligned with business goals |
| Time-bound | Measured within a defined period |
For example, “increase monthly revenue by 15% within six months” is a stronger KPI target than simply “increase revenue.”
Focus on Leading and Lagging Indicators
A balanced KPI strategy includes both leading and lagging indicators.
| Leading Indicators | Lagging Indicators |
|---|---|
| Predict future performance | Measure past performance |
| Website traffic | Revenue |
| Qualified leads | Profit margin |
| Customer enquiries | Customer retention rate |
| Sales pipeline value | Sales growth |
Leading indicators help you anticipate results, while lagging indicators confirm whether your strategies are working.
Tracking both gives a more complete view of business performance.
By choosing KPIs that align with your goals, follow the SMART framework, and balance leading and lagging indicators, you can focus on the metrics that truly drive sustainable business growth.
15 Key Performance Indicators for Small Businesses
While every business tracks numbers, not every number drives growth.
The most effective key performance indicators for small businesses provide clear insights into financial health, sales performance, customer behaviour, and operational efficiency.
The following 15 KPIs are among the most important metrics small businesses should monitor to measure performance, improve results, and achieve long-term growth.
1. Revenue Growth Rate
Revenue Growth Rate measures how quickly a business’s revenue increases over a specific period.
It is one of the most important KPIs because it shows whether the business is expanding, attracting more customers, and generating higher sales over time.
Formula
Revenue Growth Rate = ((Current Revenue − Previous Revenue) ÷ Previous Revenue) × 100
Importance
A growing revenue trend is often a sign of strong market demand, effective sales strategies, and business expansion.
Tracking revenue growth helps business owners evaluate performance, identify trends, and set realistic growth targets.
Example
If your business generated $50,000 in revenue last quarter and $60,000 this quarter:
((60,000 − 50,000) ÷ 50,000) × 100 = 20%
This means your revenue grew by 20% during the period.
How to Improve Revenue Growth Rate
- Expand your customer base through targeted marketing.
- Increase customer retention and repeat purchases.
- Introduce new products or services.
- Upsell and cross-sell to existing customers.
- Explore new markets and sales channels.
A consistently increasing Revenue Growth Rate indicates that your business is moving in the right direction and creating a solid foundation for long-term growth.
2. Gross Profit Margin
Gross Profit Margin measures the percentage of revenue a business retains after covering the direct costs of producing goods or delivering services.
It helps businesses understand how efficiently they generate profit from their core operations.
Formula
Gross Profit Margin = (Gross Profit ÷ Revenue) × 100
Example
If your business generates $100,000 in revenue and incurs $40,000 in direct costs:
Gross Profit Margin = (60,000 ÷ 100,000) × 100 = 60%
This means the business retains 60% of its revenue after covering direct costs.
How to Improve Gross Profit Margin
- Increase prices strategically where market conditions allow.
- Negotiate better rates with suppliers.
- Reduce production or service delivery costs.
- Focus on higher-margin products or services.
- Improve operational efficiency to minimise waste.
A healthy Gross Profit Margin gives a business more resources to cover operating expenses, invest in growth, and increase overall profitability.
3. Net Profit Margin
Net Profit Margin measures the percentage of revenue that remains as profit after all business expenses, including operating costs, taxes, interest, and other expenses, have been deducted.
It is one of the clearest indicators of a company’s overall financial health.
Formula
Net Profit Margin = (Net Profit ÷ Revenue) × 100
Importance
Net Profit Margin shows how effectively a business converts revenue into actual profit. A higher margin indicates better cost management, stronger financial performance, and greater capacity to reinvest in growth.
It also helps business owners assess whether increasing sales are translating into improved profitability.
Example
If a business generates $100,000 in revenue and records a net profit of $15,000:
Net Profit Margin = (15,000 ÷ 100,000) × 100 = 15%
This means the business retains $15 in profit for every $100 earned in revenue.
How to Improve Net Profit Margin
- Reduce unnecessary operating expenses.
- Improve pricing strategies.
- Increase sales of high-margin products or services.
- Streamline business processes to improve efficiency.
- Regularly review and optimise overhead costs.
A strong Net Profit Margin indicates that a business is not only generating revenue but also managing its resources effectively to achieve sustainable profitability.
4. Cash Flow
Cash Flow measures the movement of money into and out of a business over a specific period.
It shows whether a business has enough cash available to cover its expenses, meet financial obligations, and support daily operations.
Formula
Cash Flow = Total Cash Inflows − Total Cash Outflows
Importance
Cash flow is often considered the lifeblood of a business. A company can be profitable on paper and still struggle if it lacks sufficient cash to pay suppliers, employees, or operating expenses.
Monitoring cash flow helps business owners maintain financial stability, avoid liquidity problems, and plan for future growth.
Example
If a business receives $80,000 in cash during a month and spends $65,000:
Cash Flow = $80,000 − $65,000 = $15,000
This means the business has a positive cash flow of $15,000 for the period.
How to Improve Cash Flow
- Invoice customers promptly and follow up on payments.
- Reduce unnecessary expenses.
- Negotiate favourable payment terms with suppliers.
- Maintain a cash reserve for unexpected costs.
- Improve inventory management to avoid excess stock.
Consistently positive cash flow enables a business to operate smoothly, invest in opportunities, and withstand financial challenges.
5. Accounts Receivable Turnover
Accounts Receivable Turnover measures how efficiently a business collects payments from customers who purchase on credit.
It indicates how quickly outstanding invoices are converted into cash.
Formula
Accounts Receivable Turnover = Net Credit Sales ÷ Average Accounts Receivable
Importance
A high accounts receivable turnover ratio suggests that customers are paying their invoices promptly, which improves cash flow and reduces the risk of bad debts.
A low ratio may indicate collection issues, inefficient credit policies, or delayed customer payments.
Example
If a business records $500,000 in net credit sales and has an average accounts receivable balance of $50,000:
Accounts Receivable Turnover = 500,000 ÷ 50,000 = 10
This means the business collects its average receivables 10 times during the period.
How to Improve Accounts Receivable Turnover
- Issue invoices immediately after delivering products or services.
- Offer incentives for early payments.
- Implement clear payment terms and policies.
- Send payment reminders before due dates.
- Regularly follow up on overdue accounts.
A strong Accounts Receivable Turnover ratio improves cash flow, strengthens financial stability, and ensures the business has the resources needed to support growth.

6. Sales Growth Rate
Sales Growth Rate measures the increase or decrease in sales revenue over a specific period.
It helps businesses evaluate the effectiveness of their sales strategies and determine whether demand for their products or services is growing.
Formula
Sales Growth Rate = ((Current Period Sales − Previous Period Sales) ÷ Previous Period Sales) × 100
Importance
Sales Growth Rate provides a clear picture of business momentum. Consistent sales growth often indicates strong market demand, effective sales efforts, and a healthy customer base.
Monitoring this KPI helps business owners identify trends, set realistic targets, and assess the impact of growth initiatives.
Example
If a business generated $80,000 in sales last month and $100,000 this month:
Sales Growth Rate = ((100,000 − 80,000) ÷ 80,000) × 100 = 25%
This means sales increased by 25% during the period.
How to Improve Sales Growth Rate
- Strengthen your sales strategy and processes.
- Expand into new markets or customer segments.
- Improve customer retention and repeat purchases.
- Launch targeted marketing campaigns.
- Introduce complementary products or services.
A consistently increasing Sales Growth Rate is a strong indicator that a business is expanding its market reach and generating sustainable revenue growth.
7. Lead Conversion Rate
Lead Conversion Rate measures the percentage of prospects who take a desired action and become paying customers.
It is a key indicator of how effectively a business turns interest into revenue.
Formula
Lead Conversion Rate = (Number of New Customers ÷ Total Number of Leads) × 100
Importance
A high Lead Conversion Rate indicates that your sales and marketing efforts are attracting the right audience and successfully guiding them through the buying process.
It also helps businesses evaluate the effectiveness of their sales funnel and customer acquisition strategies.
Example
If your business generates 500 leads in a month and converts 50 of them into customers:
Lead Conversion Rate = (50 ÷ 500) × 100 = 10%
This means 10% of your leads became paying customers.
How to Improve Lead Conversion Rate
- Target higher-quality leads through better audience segmentation.
- Optimise landing pages and calls to action.
- Respond to enquiries quickly.
- Nurture leads with personalised communication.
- Simplify the purchasing process.
A strong Lead Conversion Rate allows businesses to generate more revenue from existing marketing and sales efforts while reducing customer acquisition costs.
8. Average Transaction Value
Average Transaction Value (ATV) measures the average amount a customer spends per purchase.
It helps businesses understand customer buying behaviour and identify opportunities to increase revenue without acquiring new customers.
Formula
Average Transaction Value = Total Revenue ÷ Number of Transactions
Importance
Average Transaction Value reveals how much revenue each sale generates on average. A higher ATV often indicates successful upselling, cross-selling, or premium pricing strategies.
Tracking this KPI helps businesses maximise revenue from existing customers and improve overall profitability.
Example
If a business generates $50,000 in revenue from 1,000 transactions:
Average Transaction Value = 50,000 ÷ 1,000 = $50
This means customers spend an average of $50 per transaction.
How to Improve Average Transaction Value
- Introduce upselling and cross-selling opportunities.
- Create product bundles or service packages.
- Offer volume discounts for larger purchases.
- Promote premium products or higher-value services.
- Set minimum order thresholds for special offers.
Increasing Average Transaction Value allows businesses to grow revenue more efficiently by generating more income from each customer purchase.
9. Customer Acquisition Cost (CAC)
Customer Acquisition Cost (CAC) measures the average amount a business spends to acquire a new customer.
It includes all sales and marketing expenses associated with attracting and converting prospects.
Formula
Customer Acquisition Cost = Total Sales and Marketing Costs ÷ Number of New Customers Acquired
Importance
CAC helps businesses determine whether their customer acquisition efforts are cost-effective.
A lower CAC generally indicates more efficient marketing and sales strategies, while a high CAC can reduce profitability and limit growth.
Example
If a business spends $10,000 on sales and marketing in a month and acquires 100 new customers:
CAC = 10,000 ÷ 100 = $100
This means the business spends an average of $100 to acquire each new customer.
How to Improve Customer Acquisition Cost
- Focus on high-performing marketing channels.
- Improve lead targeting and audience segmentation.
- Optimise conversion rates across the sales funnel.
- Strengthen referral and word-of-mouth marketing.
- Retain existing customers to reduce reliance on new acquisitions.
Monitoring Customer Acquisition Cost helps businesses allocate marketing budgets more effectively and achieve sustainable growth without overspending on customer acquisition.
10. Customer Lifetime Value (CLV)
Customer Lifetime Value (CLV) measures the total revenue a business can expect to earn from a customer throughout their relationship with the company.
It helps businesses understand the long-term value of acquiring and retaining customers.
Formula
Customer Lifetime Value = Average Purchase Value × Purchase Frequency × Customer Lifespan
Importance
CLV provides insight into how much a customer contributes to the business over time. A higher CLV indicates stronger customer loyalty, increased repeat purchases, and greater profitability.
It also helps businesses determine how much they can afford to spend on acquiring new customers.
Example
If a customer spends an average of $100 per purchase, makes 5 purchases per year, and remains a customer for 4 years:
CLV = $100 × 5 × 4 = $2,000
This means the customer is expected to generate $2,000 in revenue during their relationship with the business.
How to Improve Customer Lifetime Value
- Deliver exceptional customer experiences.
- Implement loyalty and rewards programmes.
- Encourage repeat purchases through personalised offers.
- Upsell and cross-sell relevant products or services.
- Maintain regular communication with customers.
A strong Customer Lifetime Value indicates that a business is building lasting customer relationships that drive consistent revenue and long-term growth.
See Also: What Is a Good LTV to CAC Ratio? How to Calculate LTV to CAC for Sustainable Business Growth
11. Customer Retention Rate
Customer Retention Rate measures the percentage of customers a business retains over a specific period.
It indicates how successful a company is at maintaining customer relationships and encouraging repeat business.
Formula
Customer Retention Rate = ((Customers at End of Period − New Customers Acquired) ÷ Customers at Start of Period) × 100
Importance
Acquiring new customers is often more expensive than retaining existing ones. A high Customer Retention Rate suggests strong customer satisfaction, loyalty, and long-term business stability.
It also contributes to higher profitability by increasing repeat purchases and customer lifetime value.
Example
If a business starts the year with 500 customers, acquires 100 new customers, and ends the year with 550 customers:
Customer Retention Rate = ((550 − 100) ÷ 500) × 100 = 90%
This means the business retained 90% of its existing customers during the year.
How to Improve Customer Retention Rate
- Deliver consistent product and service quality.
- Provide excellent customer support.
- Build loyalty programmes and reward repeat customers.
- Collect and act on customer feedback.
- Personalise communication and customer experiences.
A strong Customer Retention Rate helps businesses build a loyal customer base, generate predictable revenue, and reduce customer acquisition costs over time.
12. Net Promoter Score (NPS)
Net Promoter Score (NPS) measures customer loyalty and satisfaction by assessing how likely customers are to recommend a business, product, or service to others.
It is widely used as an indicator of customer experience and brand advocacy.
Formula
NPS = % Promoters − % Detractors
Customers are grouped based on their responses to the question:
“How likely are you to recommend our business to a friend or colleague?”
- Promoters (9–10): Loyal enthusiasts who actively recommend the business.
- Passives (7–8): Satisfied customers who are unlikely to promote the business.
- Detractors (0–6): Unhappy customers who may discourage others from buying.
Importance
NPS provides valuable insight into customer sentiment and loyalty.
A high score often reflects strong customer relationships, positive experiences, and a greater likelihood of referrals, while a low score can highlight areas that require improvement.
Example
If 70% of respondents are Promoters and 15% are Detractors:
NPS = 70% − 15% = 55
This gives the business a Net Promoter Score of 55.
How to Improve Net Promoter Score
- Deliver exceptional customer service consistently.
- Respond quickly to customer complaints and concerns.
- Gather feedback regularly and act on it.
- Improve product or service quality.
- Create positive customer experiences at every touchpoint.
A strong Net Promoter Score indicates that customers trust your business and are willing to recommend it, helping drive organic growth through referrals and positive word-of-mouth.
13. Employee Productivity
Employee Productivity measures how efficiently employees contribute to business output.
It helps businesses assess workforce performance and determine whether resources are being used effectively to generate revenue and achieve operational goals.
Formula
Employee Productivity = Total Revenue ÷ Number of Employees
Importance
Employee Productivity provides insight into how effectively a business converts labour into results. Higher productivity often leads to increased profitability, improved efficiency, and better resource utilisation.
It also helps identify opportunities for training, process improvement, and workforce optimisation.
Example
If a business generates $1,000,000 in annual revenue and employs 20 people:
Employee Productivity = $1,000,000 ÷ 20 = $50,000
This means each employee generates an average of $50,000 in revenue.
How to Improve Employee Productivity
- Provide employees with the right tools and technology.
- Invest in training and professional development.
- Streamline workflows and eliminate unnecessary tasks.
- Set clear goals and performance expectations.
- Recognise and reward high performance.
A strong Employee Productivity metric indicates that a business is maximising the value of its workforce while maintaining operational efficiency and supporting long-term growth.
14. Inventory Turnover
Inventory Turnover measures how efficiently a business sells and replaces its inventory over a specific period.
It is particularly important for retail, manufacturing, and e-commerce businesses that rely on inventory to generate revenue.
Formula
Inventory Turnover = Cost of Goods Sold (COGS) ÷ Average Inventory
Importance
Inventory Turnover helps businesses understand whether inventory levels are being managed effectively.
A higher turnover rate generally indicates strong sales and efficient inventory management, while a low turnover rate may suggest overstocking, slow-moving products, or weak demand.
Example
If a business records a Cost of Goods Sold of $600,000 and maintains an average inventory value of $100,000:
Inventory Turnover = $600,000 ÷ $100,000 = 6
This means the business sells and replenishes its inventory six times during the period.
How to Improve Inventory Turnover
- Forecast demand more accurately.
- Reduce excess or obsolete inventory.
- Focus on high-performing products.
- Improve inventory tracking and management systems.
- Run promotions to clear slow-moving stock.
A healthy Inventory Turnover ratio helps reduce storage costs, improve cash flow, and ensure that capital is not tied up in unsold inventory.
15. Project or Process Completion Rate
Project or Process Completion Rate measures the percentage of projects, tasks, or operational processes completed successfully within a specified timeframe.
It helps businesses evaluate efficiency, productivity, and execution performance.
Formula
Project or Process Completion Rate = (Completed Projects or Tasks ÷ Total Projects or Tasks) × 100
Importance
This KPI provides a clear indication of how effectively a business executes its plans and delivers results.
A high completion rate often reflects efficient processes, strong project management, and effective resource allocation, while a low rate may signal bottlenecks, delays, or operational inefficiencies.
Example
If a business plans to complete 50 projects in a quarter and successfully completes 45:
Project Completion Rate = (45 ÷ 50) × 100 = 90%
This means the business completed 90% of its planned projects during the period.
How to Improve Project or Process Completion Rate
- Set realistic timelines and project goals.
- Clearly define roles and responsibilities.
- Use project management tools to track progress.
- Identify and eliminate workflow bottlenecks.
- Monitor performance regularly and address delays quickly.
A strong Project or Process Completion Rate indicates that a business can consistently execute its plans, meet deadlines, and maintain operational efficiency, key factors for sustainable growth and customer satisfaction.

Creating a KPI Dashboard for Your Small Business
Tracking KPIs becomes much easier when they are organised in a single dashboard.
A KPI dashboard provides a real-time view of your business performance, allowing you to monitor critical metrics, identify trends, and make faster, data-driven decisions.
Instead of reviewing multiple spreadsheets or reports, a dashboard brings your most important KPIs together in one place, making it easier to focus on what drives growth.
Essential Components of a KPI Dashboard
An effective KPI dashboard should include metrics that align with your business goals and provide a balanced view of performance.
| KPI Category | Examples |
|---|---|
| Financial KPIs | Revenue Growth Rate, Gross Profit Margin, Net Profit Margin, Cash Flow |
| Sales KPIs | Sales Growth Rate, Lead Conversion Rate, Average Transaction Value |
| Customer KPIs | Customer Acquisition Cost, Customer Lifetime Value, Customer Retention Rate, NPS |
| Operational KPIs | Employee Productivity, Inventory Turnover, Project Completion Rate |
Focus on a manageable number of KPIs to avoid information overload.
Tools for KPI Tracking
Several tools can help small businesses build and manage KPI dashboards:
| Tool | Best For |
|---|---|
| Microsoft Excel | Basic KPI tracking and reporting |
| Google Sheets | Collaborative KPI monitoring |
| Google Looker Studio | Data visualisation and reporting |
| Tableau | Advanced business analytics |
| Power BI | Interactive dashboards and business intelligence |
| Databox | Real-time KPI tracking |
| HubSpot | Marketing and sales performance tracking |
Choose a tool that matches your business size, budget, and reporting needs.
Best Practices for Building a KPI Dashboard
- Track only the KPIs that support your business goals.
- Use simple charts and visualisations for clarity.
- Update data regularly to ensure accuracy.
- Review dashboard performance consistently.
- Share relevant insights with key team members.
A well-designed KPI dashboard transforms raw data into actionable insights, helping small business owners monitor performance, identify opportunities, and make confident decisions that support long-term growth.
KPI Benchmarks by Business Type
While KPIs provide valuable insights, their effectiveness depends on context. A healthy KPI benchmark for one business may be unrealistic or irrelevant for another.
Factors such as industry, business model, company size, and market conditions all influence performance expectations.
Rather than comparing your business to every competitor, focus on benchmarks that are relevant to your sector and growth stage.
Retail Businesses
Retail businesses typically focus on sales performance, inventory management, and customer behaviour.
| KPI | Typical Benchmark |
|---|---|
| Gross Profit Margin | 30%–50% |
| Inventory Turnover | 4–8 times per year |
| Customer Retention Rate | 60%–70% |
| Average Transaction Value | Varies by product category |
Service-Based Businesses
Service businesses rely heavily on customer relationships, productivity, and profitability.
| KPI | Typical Benchmark |
|---|---|
| Net Profit Margin | 10%–20% |
| Customer Retention Rate | 70%–85% |
| Project Completion Rate | 85%–95% |
| Employee Productivity | Consistent growth over time |
E-Commerce Businesses
E-commerce companies often prioritise customer acquisition, conversion, and customer lifetime value.
| KPI | Typical Benchmark |
|---|---|
| Lead Conversion Rate | 2%–5% |
| Customer Acquisition Cost | Industry dependent |
| Customer Lifetime Value | At least 3x CAC |
| Customer Retention Rate | 25%–40% |
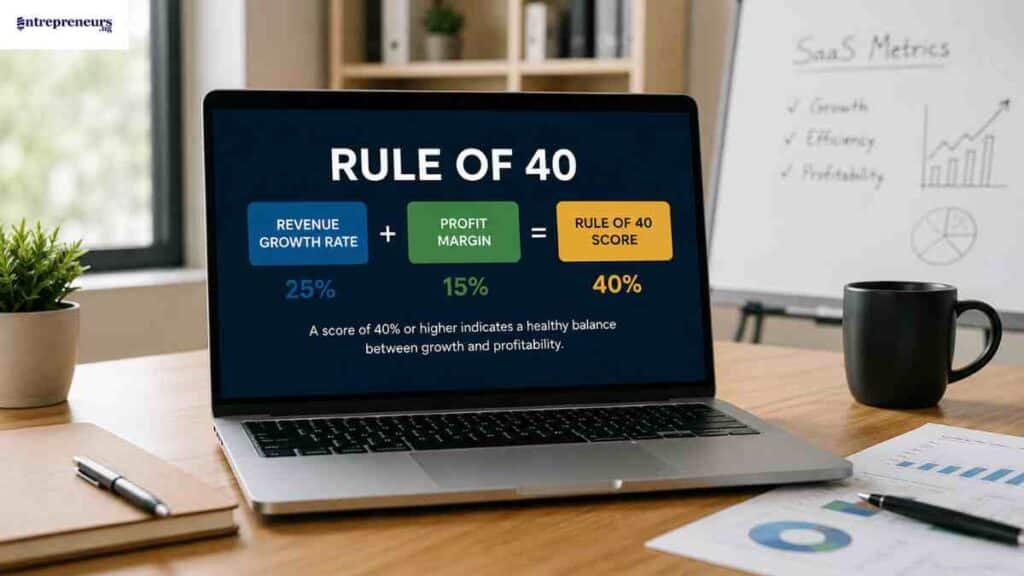
SaaS Businesses
Software-as-a-Service companies focus on recurring revenue and customer retention.
| KPI | Typical Benchmark |
|---|---|
| Customer Retention Rate | 85%–95% |
| Net Promoter Score | Above 30 |
| Customer Lifetime Value | 3–5x CAC |
| Revenue Growth Rate | 20%+ annually |
Consulting and Professional Services Firms
Consulting firms depend on efficient project delivery, client retention, and profitability.
| KPI | Typical Benchmark |
|---|---|
| Project Completion Rate | 90%+ |
| Customer Retention Rate | 75%–90% |
| Net Profit Margin | 15%–30% |
| Lead Conversion Rate | 10%–20% |
Benchmarks should serve as reference points rather than rigid targets. The most important comparison is often your own performance over time.
Consistently improving your KPIs year after year is usually a stronger indicator of success than matching an industry average.
Use benchmarks to identify opportunities for improvement, but focus on building a KPI strategy that reflects your unique business goals, market conditions, and growth ambitions.
The Future of KPI Tracking
As technology continues to evolve, KPI tracking is becoming more accurate, automated, and predictive.
Businesses are no longer limited to reviewing historical data; modern tools can now provide real-time insights and forecast future performance.
This shift enables small businesses to make faster decisions, identify opportunities earlier, and respond more effectively to market changes.
AI-Powered Analytics
Artificial intelligence is transforming how businesses analyse performance data.
AI-powered tools can automatically identify trends, detect anomalies, and generate actionable recommendations, helping business owners spend less time analysing data and more time making strategic decisions.
Predictive KPIs
Traditional KPIs measure past performance, but predictive KPIs focus on future outcomes.
Metrics such as customer churn risk, sales pipeline health, and forecasted revenue help businesses anticipate challenges and opportunities before they occur.
Real-Time Dashboards
Modern KPI dashboards provide instant access to performance data.
Instead of waiting for weekly or monthly reports, business owners can monitor key metrics in real time and take immediate action when performance changes.
Automated Reporting
Automation is reducing the time and effort required to track KPIs.
Many business intelligence platforms can automatically collect data, generate reports, and deliver performance updates, ensuring that decision-makers always have access to current information.
Data-Driven Decision Making Will Become the Norm
As competition increases, businesses that rely on intuition alone may struggle to keep pace.
Organisations that use KPIs to guide strategy, allocate resources, and measure outcomes will be better positioned to improve efficiency, drive growth, and maintain a competitive advantage.
The future of KPI tracking lies in turning data into foresight.
Businesses that embrace automation, predictive analytics, and real-time reporting will be able to make smarter decisions and achieve sustainable growth in an increasingly data-driven world.
Conclusion
Tracking the right KPIs can mean the difference between making decisions based on assumptions and making decisions backed by data.
From financial performance and sales growth to customer retention and operational efficiency, the 15 key performance indicators discussed in this guide provide a clear framework for measuring business success.
We want to see you succeed, and that’s why we provide valuable business resources to help you every step of the way.
- Join over 23,000 entrepreneurs by signing up for our newsletter and receiving valuable business insights.
- Register your business today with Entrepreneurs.ng’s Business Registration Services.
- Tell Your Brand Story on Entrepreneurs.ng, let’s showcase your brand to our global audience.
- Need help with your marketing strategy? Get a Comprehensive Marketing and Sales Plan here.
- Sign up for our Entrepreneurs Success Blueprint Programme to learn how to start and scale your business in just 30 days.
- Book our one-on-one consulting and speak to an expert about structuring and growing your business.
- Visit our shop for business plan templates and other valuable resources to guide you.
- Get our Employee-Employer Super Bundle NDA templates to legally protect your business and workforce.
- Advertise your business to over a million entrepreneurs through our different advertising packages.

Frequently Asked Questions (FAQs)
What are key performance indicators (KPIs) in business?
Key performance indicators (KPIs) are measurable values that help businesses track progress towards specific goals. They provide insights into performance, efficiency, profitability, and growth.
Why are KPIs important for small businesses?
KPIs help small business owners make data-driven decisions, identify opportunities for improvement, measure success, and ensure resources are being used effectively.
What are the most important KPIs for small businesses?
Some of the most important KPIs for small businesses include Revenue Growth Rate, Net Profit Margin, Cash Flow, Customer Acquisition Cost, Customer Lifetime Value, Customer Retention Rate, and Lead Conversion Rate.
What is the difference between a KPI and a metric?
A KPI is a metric tied directly to a strategic business objective, while a metric measures general business activity. Every KPI is a metric, but not every metric is a KPI.
How many KPIs should a small business track?
Most small businesses should focus on 5 to 15 KPIs that align with their goals. Tracking too many KPIs can create confusion and make decision-making more difficult.
What are the best financial KPIs for small businesses?
The most commonly used financial KPIs include Revenue Growth Rate, Gross Profit Margin, Net Profit Margin, Cash Flow, and Accounts Receivable Turnover.
Which sales KPIs should small businesses monitor?
Key sales KPIs include Sales Growth Rate, Lead Conversion Rate, Average Transaction Value, and Customer Acquisition Cost.
What are customer KPIs and why do they matter?
Customer KPIs measure customer behaviour, satisfaction, and loyalty. Examples include Customer Retention Rate, Customer Lifetime Value, and Net Promoter Score (NPS).
What is a good Customer Acquisition Cost (CAC)?
A good CAC varies by industry, but it should be significantly lower than Customer Lifetime Value (CLV). Many businesses aim for a CLV-to-CAC ratio of at least 3:1.
What is Customer Lifetime Value (CLV)?
Customer Lifetime Value estimates the total revenue a business can expect from a customer throughout the entire relationship with the company.
How often should KPIs be reviewed?
Most KPIs should be reviewed monthly, while critical metrics such as cash flow, sales performance, and lead generation may require weekly or even daily monitoring.
What are leading and lagging KPIs?
Leading KPIs predict future performance, such as website traffic or qualified leads. Lagging KPIs measure past performance, such as revenue and profit margins.
How can small businesses improve KPI performance?
Businesses can improve KPI performance by setting clear goals, monitoring data consistently, identifying weaknesses, and taking corrective action based on insights.
What is a KPI dashboard?
A KPI dashboard is a visual tool that displays key business metrics in one place, making it easier to monitor performance, track trends, and make informed decisions.
Can a small business have too many KPIs?
Yes. Tracking too many KPIs can lead to information overload and distract business owners from the metrics that truly impact growth and profitability.
What are the best KPI tracking tools for small businesses?
Popular KPI tracking tools include Microsoft Excel, Google Sheets, Google Looker Studio, Tableau, Power BI, Databox, and HubSpot.
How do I choose the right KPIs for my business?
Choose KPIs that align with your business objectives, follow the SMART framework, and provide actionable insights that support growth, profitability, customer retention, or operational efficiency.
What is the most important KPI for business growth?
There is no single KPI that applies to every business. However, Revenue Growth Rate, Customer Retention Rate, Customer Lifetime Value, and Cash Flow are often considered among the most important indicators of long-term business growth.