The BCG Matrix is a practical way for business leaders to decide where to invest, where to protect profits, and where to walk away.
Developed by Boston Consulting Group, the framework helps companies compare products and business units based on market growth and competitive strength, so strategy is driven by evidence, not instinct.
In this guide, you will learn how the BCG Matrix works, what each quadrant means, and how to use it to make smarter strategic decisions.
Key Takeaways
- The BCG Matrix helps you decide where to invest, maintain, or exit by comparing market growth with relative market share.
- Stars, Cash Cows, Question Marks, and Dogs reveal the true strategic role each product or business unit plays.
- The framework supports disciplined resource allocation, reducing emotional and reactive decision-making.
- Used correctly, the BCG Matrix strategy turns portfolio analysis into clearer growth, funding, and exit decisions.

What Is the BCG Matrix?
The BCG Matrix is a strategic portfolio analysis framework developed by the to help businesses evaluate how well their products, services, or business units perform within their markets.
It compares two critical factors: market growth rate and relative market share to show where a business should invest, maintain focus, or consider exiting.
Commonly known as the BCG growth share matrix, the model groups offerings into Stars, Cash Cows, Question Marks, and Dogs.
This structure makes business portfolio analysis more practical by turning complex performance data into clear strategic signals.
Understanding the Core Idea Behind the BCG Matrix
The BCG Matrix is built on a straightforward strategic principle: businesses perform better when they allocate resources based on market reality rather than instinct.
To understand how the matrix guides decisions, it is important to first grasp the thinking behind it.
This section explains the logic of portfolio analysis, why market growth and market share are used as the core measures, and how these ideas translate into clear strategic direction.
Seeing the Business as a Portfolio
The BCG Matrix starts with the idea that a business should be managed as a portfolio of products or services, not as a collection of independent offerings.
Each product competes for the same limited resources, including capital, management attention, and operational capacity.
By analysing all offerings together, leaders can see which ones drive growth, which ones generate cash, and which ones no longer justify continued investment.
This portfolio view reduces emotional bias and encourages more disciplined decision-making.
Why Growth and Market Share Are the Chosen Measures
The framework relies on two variables because they capture the most important strategic signals.
Market growth indicates opportunity. Fast-growing markets demand investment but offer future potential.
Relative market share reflects competitive strength and cost efficiency, which often translate into stronger margins.
Together, these measures reveal whether a product is consuming cash, generating cash, or positioned to do either in the future.
Turning Strategic Insight into Action
The core idea of the BCG Matrix is not analysis for its own sake. It is about using simple classifications to guide real decisions.
Once products are grouped based on growth and market share, leaders can make clearer choices about investment, maintenance, or exit.
This disciplined approach helps businesses align ambition with economic reality and move from scattered decision-making to focused strategic execution.
The Two Axes of the BCG Matrix
The BCG Matrix is built on two carefully chosen measures that reveal how each product or business unit truly performs.
These axes are not arbitrary. Together, they explain where opportunity exists, where strength lies, and where resources are being stretched too thin.
Understanding them properly is essential before placing anything on the matrix.
Market Growth Rate: Measuring Opportunity
Market growth rate represents how quickly a market is expanding.
It signals the level of opportunity available to businesses operating within that space.
High-growth markets tend to attract new customers, innovation, and competition. However, they also demand continuous investment in marketing, capacity, talent, and product development.
Low-growth markets, on the other hand, offer fewer expansion opportunities but are often more stable and predictable.
In the BCG Matrix, market growth helps answer a critical question: Is this market worth continued investment based on its future potential?
Relative Market Share: Measuring Competitive Strength
Relative market share compares your product’s market share to that of your largest competitor. It is not about absolute size, but about strength within the competitive landscape.
A high relative market share often leads to economies of scale, stronger pricing power, and better margins.
Businesses with lower market share typically face higher costs and weaker bargaining positions, even in attractive markets.
This axis answers another key question: How strong is your position compared to competitors?
How the Two Axes Work Together
Individually, market growth and market share provide useful insights. Combined, they offer strategic clarity.
A product in a fast-growing market may still be a poor investment if it lacks competitive strength. Likewise, a dominant product in a slow-growing market can be extremely valuable if it generates steady cash.
The interaction between these two axes is what gives the BCG Matrix its power.
It allows leaders to balance opportunity with strength and make decisions that are grounded in both market reality and competitive position.

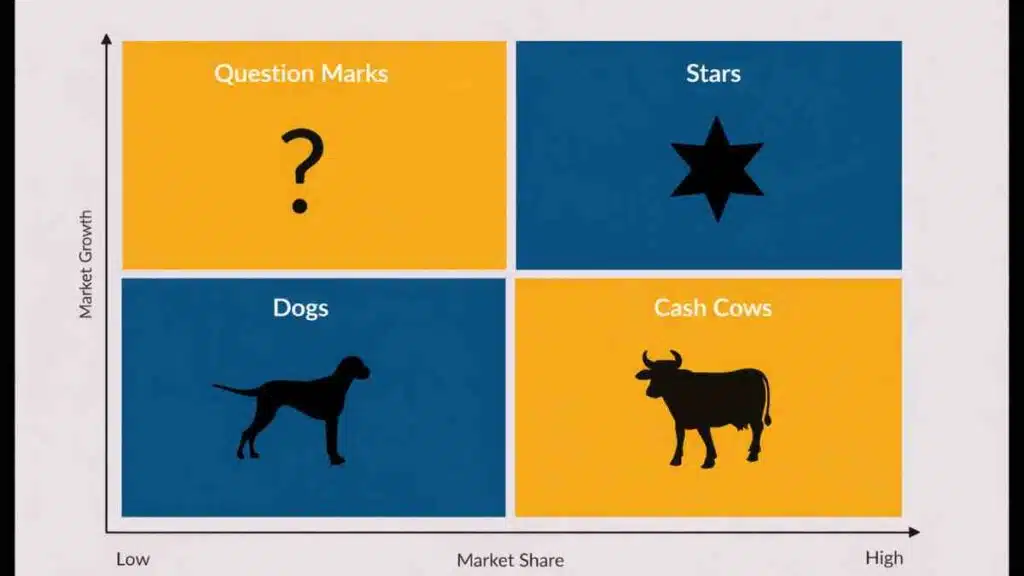
The Four Quadrants of the BCG Matrix
The BCG Matrix divides a business portfolio into four distinct categories based on the interaction between market growth rate and relative market share.
These quadrants are the practical output of the framework. They translate analysis into clear strategic meaning and help leaders understand the role each product or business unit plays within the wider organisation.
Each quadrant carries different implications for investment, risk, and long-term value.
By understanding how Stars, Cash Cows, Question Marks, and Dogs function, businesses can move from observation to action and make more deliberate, evidence-based strategic decisions.
Stars – High Growth, High Market Share
In the BCG Matrix, Stars represent products or business units that operate in rapidly growing markets while holding a strong competitive position.
They are often at the centre of a company’s growth story and tend to attract significant attention from leadership because of their future potential.
Although Stars generate high revenue, they also consume substantial resources. Fast-growing markets are competitive and demand continuous investment to defend market share and stay ahead of rivals.
The strategic objective is not short-term profit, but long-term dominance.
| Aspect | What It Means for Stars |
|---|---|
| Market position | Strong leadership in a fast-growing market |
| Cash flow | High revenue, but cash is often reinvested |
| Investment need | Heavy and ongoing investment required |
| Strategic priority | Protect and strengthen market leadership |
| Future outlook | Likely to become Cash Cows as growth slows |
From a strategic standpoint, Stars require discipline and commitment.
When managed well, they evolve into reliable profit generators. When underfunded or poorly executed, they can quickly lose momentum and slide into weaker positions on the matrix.
Cash Cows – Low Growth, High Market Share
Cash Cows occupy a critical position in the BCG Matrix. They operate in mature or slow-growing markets but hold a strong competitive position.
Because growth demands are low, these products or business units generate more cash than they consume.
Cash Cows are the financial engine of the business. They fund Stars, support promising Question Marks, and stabilise overall operations.
The strategic focus here is efficiency, cost control, and protection of market share rather than aggressive expansion.
| Aspect | What It Means for Cash Cows |
|---|---|
| Market position | Market leader in a mature or slow-growing market |
| Cash flow | Strong and predictable positive cash flow |
| Investment need | Low to moderate, focused on efficiency |
| Strategic priority | Maintain position and maximise profitability |
| Role in portfolio | Fund growth in other parts of the business |
Well-managed Cash Cows provide long-term stability. However, complacency is a common risk.
When businesses overexploit them without reinvesting enough to stay competitive, even strong Cash Cows can slowly decline and lose their strategic value.
Question Marks – High Growth, Low Market Share
Question Marks sit in fast-growing markets but lack a strong competitive position. In the BCG Matrix, they represent uncertainty and strategic tension.
These products or business units show potential, but they consume cash without generating enough return to sustain themselves.
Because market growth is high, Question Marks demand investment. However, there is no guarantee that this investment will translate into market leadership.
The core strategic challenge is deciding which Question Marks are worth backing and which should be exited early.
| Aspect | What It Means for Question Marks |
|---|---|
| Market position | Weak or emerging position in a fast-growing market |
| Cash flow | Negative, due to high investment needs |
| Investment need | High and often risky |
| Strategic priority | Decide whether to invest heavily or divest |
| Future outlook | Can become Stars or slide into Dogs |
Question Marks require clear judgment and strong execution. Investing in too many spreads resources thin, while exiting too early can mean missing future growth.
Successful businesses are selective, backing only those Question Marks with a realistic path to gaining market share.
Dogs – Low Growth, Low Market Share
Dogs represent products or business units that operate in slow-growing markets and hold a weak competitive position.
In the BCG Matrix, they are often the least attractive quadrant because they tie up resources without delivering meaningful growth or cash returns.
While Dogs are frequently associated with divestment, the decision is not always automatic.Some Dogs may still serve a strategic purpose, such as supporting a broader product range or maintaining customer relationships.
However, they must be closely scrutinised to avoid draining capital and management attention.
| Aspect | What It Means for Dogs |
|---|---|
| Market position | Weak position in a low-growth market |
| Cash flow | Low or marginal, sometimes negative |
| Investment need | Minimal or none |
| Strategic priority | Divest, harvest, or reposition |
| Portfolio impact | Often drags overall performance |
From a strategic perspective, Dogs demand tough decisions. Holding on to them out of habit or emotional attachment can quietly erode profitability.
Effective portfolio management requires recognising when a product no longer earns its place in the business.

How to Create a BCG Matrix for Your Business
Creating a BCG Matrix for your business is a practical exercise that turns strategy into action.
Rather than relying on assumptions, the process helps you assess each product or business unit using consistent criteria.
This section walks through the key steps involved, from identifying what to analyse to plotting each offering on the matrix, so you can make clear, data-driven decisions about investment, growth, and exit.
Step 1: List the products, services, or business units you want to analyse
Start by deciding what you are actually plotting.
The BCG Matrix works best when each item has its own strategy, budget, and performance metrics.
| What you can plot | Examples | Best used when |
|---|---|---|
| Products | A software tool, a beverage line, a skincare range | You manage multiple distinct offers |
| Services | Consulting packages, delivery tiers, subscription plans | You price and sell services differently |
| Business units | Regions, divisions, brands, subsidiaries | You run a multi-market or multi-brand business |
Tip: If two offerings share the same customers, pricing, and operations, treat them as one unit to avoid noisy analysis.
Step 2: Define the market for each unit.
Many businesses get wrong answers because they define the market poorly. A “market” should reflect the customer’s real alternatives.
| Good market definition | Why it works |
|---|---|
| “Mid-market payroll software for companies with 50–500 staff” | Clear buyer, clear alternatives |
| “On-demand grocery delivery in major cities” | Specific geography and category |
| “Premium natural skincare for sensitive skin” | Narrow positioning and competitive set |
| Weak market definition | Why it fails |
|---|---|
| “Tech” | Too broad; competitors are unclear |
| “Food business” | Not a market; it is an industry |
| “Online services” | No useful strategic insight |
Rule: If you cannot name your top 3 competitors in that market, your market definition is too broad.
Step 3: Estimate the market growth rate
Market growth rate tells you whether the market is expanding quickly (needs investment) or maturing (focus shifts to efficiency and cash generation).
| How to estimate growth | Where to get the data |
|---|---|
| Use industry reports and market research summaries. | Statista, IBISWorld, Gartner, Euromonitor (depending on sector) |
| Use publicly available category trends | Company annual reports, investor decks, industry associations |
| Use internal trend proxies | YoY sales growth for the category, customer demand signals, pipeline growth |
| Use government or official datasets where relevant | World Bank, OECD, national statistics offices |
Practical guidance: You do not need perfect numbers. You need consistent estimates across your portfolio.
Step 4: Calculate relative market share
Relative market share is your market share compared to the largest competitor in that market.
Formula: Relative Market Share = (Your market share) ÷ (Largest competitor’s market share)
| Example | Result | Interpretation |
|---|---|---|
| You have 20% share, biggest competitor has 40% | 0.5 | You are half as strong as the leader |
| You have 30%, biggest competitor has 15% | 2.0 | You are twice the leader’s share |
| You have 10%, biggest competitor has 10% | 1.0 | You are on equal footing |
If you do not have formal market share data, use strong proxies such as revenue in that category, customer volume, active users, distribution footprint, or share of shelf (for physical goods). The key is consistency.
Step 5: Set thresholds for “high” and “low”
To place items into quadrants, define what “high” and “low” mean for your business.
| Axis | Common approach | Better approach |
|---|---|---|
| Market growth | Use a general cut-off (e.g., 10% growth = high) | Use your industry average as the benchmark |
| Relative market share | Above 1.0 = high, below 1.0 = low | Adjust if the market is highly fragmented |
Tip: In some markets, being number 3 can still be “high share” if the market is fragmented and leadership is weak.
Step 6: Plot each item on the BCG Matrix
Once you have growth rate and relative market share, you can place each unit into the matrix.
| Quadrant | Market growth | Relative market share | What it usually means |
|---|---|---|---|
| Stars | High | High | Invest to defend leadership and grow |
| Cash Cows | Low | High | Optimise and use profits to fund growth elsewhere |
| Question Marks | High | Low | Decide whether to invest heavily or exit early |
| Dogs | Low | Low | Harvest, reposition, or divest |
Optional but powerful: make bubble sizes reflect revenue, profit, or customer base. That way, the matrix shows not just position, but economic importance.
Step 7: Turn the matrix into decisions
The point of the matrix is action. Use it to guide investment, budgeting, staffing, and product roadmaps.
| Quadrant | Decision focus | Typical actions |
|---|---|---|
| Stars | Growth and defence | Increase investment, expand capacity, strengthen advantage |
| Cash Cows | Profit and efficiency | Reduce waste, maintain share, protect margins, fund other units |
| Question Marks | Selective bets | Choose winners, invest to gain share, test aggressively, cut losers |
| Dogs | Exit or containment | Harvest cash, reduce complexity, divest, reposition only if strategic |
Step 8: Review regularly and track movement over time
The BCG Matrix is not a one-time exercise. Markets change, competitors react, and products mature.
| Review cycle | Best for |
|---|---|
| Quarterly | Fast-moving industries (tech, consumer trends, media) |
| Twice a year | Most growth-stage businesses |
| Annually | Mature industries with stable demand |
Track whether products move between quadrants and why. That narrative is often more valuable than the initial plot.
Sample BCG Matrix for a Hypothetical Company
To make the BCG Matrix easier to understand, here is a clean, realistic example using a fictional global company.
The aim is to show how the framework translates data into clear strategic choices.
The Company: NovaCorp
NovaCorp is a diversified company operating across consumer technology and digital services.
It manages four core products, each competing in a different market with varying growth rates and competitive strength.
NovaCorp’s Product Portfolio
| Product | Market | Market Growth | Relative Market Share |
|---|---|---|---|
| NovaCloud | Cloud collaboration software | High | High |
| NovaPhone | Mid-range smartphones | Low | High |
| NovaPay | Digital payments platform | High | Low |
| NovaPrint | Office printing hardware | Low | Low |
How Each Product Fits Into the BCG Matrix
| Quadrant | Product | Explanation |
|---|---|---|
| Star | NovaCloud | Operates in a fast-growing market and holds strong competitive leadership |
| Cash Cow | NovaPhone | Dominant position in a mature market with steady demand |
| Question Mark | NovaPay | High-growth market, but weak market share and heavy competition |
| Dog | NovaPrint | Declining market and limited competitive strength |
Strategic Decisions Based on the Matrix
| Product | Strategic Focus |
|---|---|
| NovaCloud (Star) | Invest aggressively to protect leadership and scale growth |
| NovaPhone (Cash Cow) | Maintain efficiency and use profits to fund growth areas |
| NovaPay (Question Mark) | Decide whether to invest heavily to gain share or exit early |
| NovaPrint (Dog) | Harvest remaining value or divest to free up resources |
How to Use the BCG Matrix for Strategic Business Decisions
The BCG Matrix is most valuable when it is used as a decision-making tool, not just a visual model.
Once products or business units are positioned within the matrix, leaders can make clearer choices about where to invest, where to protect profits, and where to reduce exposure.
This section explains how to translate the matrix into practical strategic actions.
Guiding Resource Allocation
The matrix helps businesses allocate limited resources more deliberately.
Stars and selected Question Marks typically require capital, talent, and management attention, while Cash Cows are expected to generate surplus funds rather than consume them.
Dogs, unless they serve a specific strategic purpose, should receive minimal resources.
This approach prevents over-investing in low-potential areas and ensures that high-impact opportunities are properly funded.
Shaping Investment and Divestment Decisions
One of the clearest uses of the BCG Matrix is deciding where to invest and where to exit. Products positioned as Stars usually justify continued investment to maintain leadership.
Question Marks demand a clear choice. Either the business commits to gaining market share or exits early to avoid ongoing losses.
Dogs often trigger divestment or harvesting decisions, freeing capital for higher-growth opportunities.
Managing the Product or Business Lifecycle
The BCG Matrix supports long-term planning by showing how products typically move across quadrants over time.
Stars can become Cash Cows as markets mature. Cash Cows may eventually decline into Dogs if demand falls or competition intensifies.
Understanding these shifts allows leaders to plan ahead, reinvest at the right time, and avoid being caught off guard by market changes.
Supporting Growth and Expansion Strategy
For growth-focused decisions, the matrix highlights where expansion efforts are most likely to succeed.
Stars often form the foundation of future growth, while carefully chosen Question Marks can become the next generation of growth drivers.
By contrast, relying on Cash Cows for expansion in low-growth markets can limit long-term potential.
Improving Strategic Focus and Alignment
Perhaps most importantly, the BCG Matrix creates a shared language for strategic discussions.
It aligns leadership teams around facts rather than opinions and helps communicate priorities across the organisation.
When used consistently, the matrix supports faster decision-making, better prioritisation, and stronger alignment between strategy and execution.

Limitations and Criticisms of the BCG Matrix
While the BCG Matrix is a powerful tool for simplifying strategic choices, it is not without flaws. Used in isolation, it can lead to oversimplified conclusions or misguided decisions.
Understanding its limitations helps leaders apply the framework more thoughtfully and avoid common strategic traps.
| Limitation | What It Means in Practice | Importance |
|---|---|---|
| Overly simplistic view of markets | Reduces complex market dynamics to just growth and market share | Important factors like customer loyalty, regulation, and innovation are ignored |
| Assumes market share equals profitability | High market share does not always lead to high margins | Some industries reward differentiation, not scale |
| Ignores synergies between business units | Treats each product as independent | Shared capabilities or cross-selling opportunities may be undervalued |
| Encourages short-term thinking | Focuses heavily on current position | Long-term strategic bets may be prematurely abandoned |
| Data dependency and estimation risk | Relies on accurate growth and share data | In emerging or fragmented markets, data can be unreliable |
| Limited guidance for service and platform businesses | Designed originally for product-based portfolios | Digital, network-driven models may not fit neatly into quadrants |
The BCG Matrix works best as a starting point, not a final answer. When combined with other strategic tools and sound judgment, it provides clarity.
When used alone or rigidly, it risks oversimplifying decisions that require deeper analysis.
How to Adapt the BCG Matrix for Modern Businesses
The BCG Matrix was created in a very different business era, yet its core logic still holds. What has changed is how markets behave, how competition forms, and how value is created.
To remain useful today, the matrix must be applied with flexibility and updated assumptions.
This section explains how modern businesses can adapt the framework to reflect digital models, complex portfolios, and fast-moving global markets.
Adapting the BCG Matrix for Digital and Technology-Driven Businesses
Digital and technology-based businesses often scale differently from traditional product companies.
Network effects, platforms, and data-driven models can distort simple market share assumptions.
| Traditional Assumption | Modern Adjustment |
|---|---|
| Market share reflects strength | User engagement, active users, or ecosystem control may matter more |
| Revenue defines performance | Customer lifetime value and retention are often better indicators |
| Growth is linear | Growth can be exponential or winner-takes-most |
For digital products, a “Star” may still be loss-making but strategically dominant. The key is to judge competitive advantage beyond short-term profitability.
Using Alternative Metrics Alongside Growth and Market Share
Modern businesses often need richer signals to place products accurately on the matrix.
| Metric Type | Examples | When to Use |
|---|---|---|
| Customer metrics | Retention, churn, lifetime value | Subscription and SaaS businesses |
| Engagement metrics | Daily active users, usage frequency | Platforms and digital services |
| Economics | Unit economics, contribution margin | Early-stage or scaling businesses |
| Strategic control | Data ownership, switching costs | Ecosystem-driven models |
These metrics do not replace the BCG Matrix axes. They strengthen the interpretation of each quadrant.
Combining the BCG Matrix with Other Strategy Frameworks
Used alone, the BCG Matrix can oversimplify decisions. Modern strategy benefits from layered analysis.
| Framework | What It Adds |
|---|---|
| SWOT Analysis | Internal strengths and external risks |
| Porter’s Five Forces | Competitive intensity and profitability drivers |
| Ansoff Matrix | Growth options beyond current markets |
| Product lifecycle analysis | Timing and maturity context |
This combination helps avoid rigid, one-dimensional decisions.
Applying the BCG Matrix in Fast-Changing and Emerging Markets
Volatile markets require more frequent reviews and looser thresholds.
| Challenge | Practical Adaptation |
|---|---|
| Unstable growth rates | Use ranges rather than fixed cut-offs |
| Limited data | Rely on trend direction, not precision |
| Rapid competitive shifts | Review the matrix more frequently |
| Informal competition | Use proxies such as distribution reach or brand strength |
In these environments, the direction of movement across quadrants often matters more than exact placement.
Using the BCG Matrix as a Dynamic, Ongoing Tool
Modern businesses benefit most when the BCG Matrix is treated as a living framework.
| Best Practice | Why It Is Important |
|---|---|
| Review regularly | Markets and products evolve quickly |
| Track movement over time | Strategic trends matter more than snapshots |
| Link to budgeting cycles | Ensures insights drive real decisions |
| Use it for debate, not rules | Encourages better judgment and alignment |
When adapted thoughtfully, the BCG Matrix remains a valuable strategic lens.
It works best not as a rigid model, but as a disciplined way to ask better questions and make more intentional business decisions.
Common Mistakes Entrepreneurs Make When Using the BCG Matrix
Entrepreneurs often misuse the BCG Matrix not because the framework is flawed, but because it is applied too casually.
The table below highlights the most common errors and how to avoid them, so the matrix leads to better strategic decisions.
| Common Mistake | Why It Happens | Practical Solution |
|---|---|---|
| Defining markets too broadly | Entrepreneurs think bigger markets give better insight | Define markets from the customer’s perspective and narrow them until competitors are clearly identifiable |
| Using intuition instead of data | Reliable data feels hard to access | Use consistent estimates and proxies rather than perfect data; accuracy matters less than consistency |
| Treating the matrix as a one-time task | Strategy is seen as a static exercise | Review and update the matrix regularly to reflect market and performance changes |
| Investing in too many Question Marks | Fear of missing out on growth | Selectively back only Question Marks with a clear path to market leadership |
| Ignoring cash flow realities | Growth is prioritised over financial discipline | Use Cash Cows deliberately to fund growth, not just to boost short-term profits |
| Holding on to Dogs emotionally | Founders become attached to legacy products | Apply objective performance criteria and set clear exit thresholds in advance |
| Using the matrix in isolation | The model feels “complete” on its own | Combine the BCG Matrix with other tools like SWOT or competitive analysis |
| Assuming market share equals profitability | Scale is mistaken for success | Validate profitability and unit economics before committing investment |
When these mistakes are addressed, the BCG Matrix becomes not just a classification tool but a decision framework.
The difference lies in disciplined application, regular review, and the willingness to make uncomfortable but necessary choices.
Conclusion
The BCG Matrix remains a practical tool for making clearer, more disciplined strategic decisions.
When used thoughtfully, it helps businesses prioritise investment, manage risk, and allocate resources where they create the most value.
We want to see you succeed, and that’s why we provide valuable business resources to help you every step of the way.
- Join over 23,000 entrepreneurs by signing up for our newsletter and receiving valuable business insights.
- Register your business today with Entrepreneurs.ng’s Business Registration Services.
- Tell Your Brand Story on Entrepreneurs.ng, let’s showcase your brand to our global audience.
- Need help with your marketing strategy? Get a Comprehensive Marketing and Sales Plan here.
- Sign up for our Entrepreneurs Success Blueprint Programme to learn how to start and scale your business in just 30 days.
- Book our one-on-one consulting and speak to an expert about structuring and growing your business.
- Visit our shop for business plan templates and other valuable resources to guide you.
- Get our Employee-Employer Super Bundle NDA templates to legally protect your business and workforce.
- Advertise your business to over a million entrepreneurs through our different advertising packages.

Frequently Asked Questions (FAQs)
What is the BCG Matrix used for?
The BCG Matrix is used to analyse a company’s product or business portfolio and guide decisions on investment, growth, maintenance, or exit.
Who developed the BCG Matrix?
The BCG Matrix was developed by the Boston Consulting Group as a strategic planning tool.
What are the four quadrants of the BCG Matrix?
The four quadrants are Stars, Cash Cows, Question Marks, and Dogs, each representing a different strategic role.
What does market growth rate mean in the BCG Matrix?
Market growth rate shows how fast a market is expanding and indicates the level of opportunity and investment required.
What is relative market share in the BCG Matrix?
Relative market share compares your product’s market share to that of the largest competitor to assess competitive strength.
Is the BCG Matrix only for large companies?
No. Startups, SMEs, and large organisations can all use the BCG Matrix, provided it is adapted to their scale and data availability.
How often should a business update its BCG Matrix?
Most businesses should review their BCG Matrix at least once a year, or more frequently in fast-changing industries.
Can service-based businesses use the BCG Matrix?
Yes. Service businesses can use the matrix by applying alternative metrics such as customer volume, revenue share, or utilisation rates.
Are Stars always profitable?
Not necessarily. Stars often generate high revenue but usually require heavy investment, which can limit short-term profits.
Why are Cash Cows important in the BCG Matrix?
Cash Cows generate steady cash flow that funds growth initiatives, including Stars and selected Question Marks.
What should a company do with Question Marks?
A company must decide whether to invest heavily to gain market share or exit early to avoid prolonged losses.
Are Dogs always bad for a business?
Not always. Some Dogs may support other products or serve niche strategic purposes, but they should be closely monitored.
What are the main limitations of the BCG Matrix?
The matrix can oversimplify markets, ignore synergies, and assume market share always leads to profitability.
Can the BCG Matrix be combined with other strategy tools?
Yes. It works best when combined with tools like SWOT analysis, Porter’s Five Forces, or product lifecycle analysis.
Is the BCG Matrix still relevant today?
Yes. When adapted for modern markets and used as a dynamic tool, the BCG Matrix remains highly relevant.
What is the biggest mistake businesses make with the BCG Matrix?
The biggest mistake is treating it as a one-time exercise instead of a framework that evolves with market conditions.